Picture this. Your sales team has one set of numbers. Finance has another. Then operations say both are wrong. Sound familiar? If so, you are not alone. In fact, the average company now runs more than 1,000 apps, but only about 29% of them link together. That gap is precisely where EO PIS comes in.
Put simply, EO PIS is a way to pull all your business data into one clear view. As a result, leaders can spot problems early and act fast. In this listicle, you will learn what EO PIS means and how its intelligence system works.
You will also receive seven key strategies and a straightforward plan to kickstart your journey. So, let’s dive in.
EO PIS at a Glance: Key Numbers
| Key Stat | What It Means | Source |
| 1,061 apps, 29% linked | Average firms run over 1,000 apps, but most stay in silos. | MuleSoft 2023 |
| $12.9M a year | Average yearly cost of poor data quality per firm | Gartner |
| 23x more likely | Data-driven firms win more customers. | McKinsey Global Institute |
| +24% automation, -11% rework | Siemens order-to-cash results with process mining | Celonis / Siemens |
What Is EO PIS? A Simple Look at the Enterprise Operations Process Information System
EO PIS most often stands for Enterprise Operations Process Information System. However, some writers call it an Enterprise Operations Performance Information System. Either way, the core idea stays the same.
It is one system that gathers data from every part of your business. Then it makes sense of that data and shows leaders what to do next. For instance, think of it like the dashboard in your car. You don’t check the engine, the fuel, and the tires one by one.
Instead, one screen tells you everything at a glance. In the same way, EO PIS performs this task for the entire company.
The Honest Truth Most Listicles Skip
Here is something many listicles leave out. EO PIS is not a single product you can buy. You won’t find an “EO PIS” box from Microsoft or SAP. Rather, it is a framework. In other words, it is a blueprint for linking tools you may already own.
These include your ERP, your CRM, your HR system, and your BI dashboards. Why does this matter? Because it changes how you shop.
So instead of hunting for “EO PIS software,” ask a better question. Which pieces do we already have, and which ones are missing? That one shift can save you months and a lot of money.
Why Businesses Need It Now
The need is very real. For one thing, bad data costs money. Gartner puts the cost of poor data quality at $12.9 million a year for the average firm. Conversely, good data yields significant returns.
McKinsey found that data-driven firms are 23 times more likely to win customers and 19 times more likely to be profitable.
EO PIS vs. Traditional KPIs
Old-style KPIs live in silos. Marketing tracks leads, while finance tracks cash. Yet nobody sees how one affects the other. By contrast, an EO PIS links them together.
For example, it might show that a slow approval step in buying is the real reason orders ship late. In short, it connects separate numbers into a single, cohesive story.
Core Components of the EO PIS Intelligence System
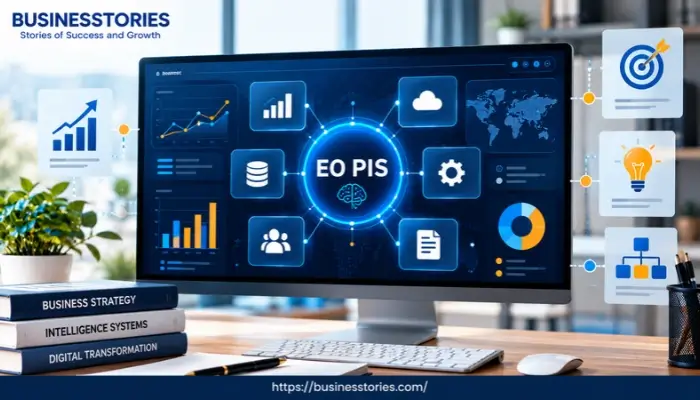
Now that you understand its purpose, let’s look closer at how it works. A strong EO PIS intelligence system has four main layers. Most guides often overlook a fifth layer.
1. The Data Integration Layer
First comes the base. This layer pulls data from all your tools into one place. That means finance, sales, HR, supply chain, and customer support. Without it, nothing else works.
After all, you can’t see the big picture if half the pieces are missing. Most firms use APIs, data pipelines, or a cloud data warehouse for this step.
2. The Process Monitoring Layer
Next, this layer watches how work really flows. For instance, it tracks how long it takes to approve a purchase order. It also tracks where tasks become stuck. Here, the “process” part of the name earns its keep. Instead of just showing results, it shows how those results were achieved.
3. The Analytics and AI Layer
Then comes the brain. This layer finds patterns and trends in your data. It can also make predictive analytics forecasts, such as which customers might leave next month.
Better still, AI can flag odd changes the moment they appear. As a result, you resolve issues before they grow.
4. The Decision and Dashboard Layer
Thereafter, insights need a home. This layer turns data into clear charts, scorecards, and alerts. Each leader sees the numbers that matter to them. The CFO sees cash flow, while the COO sees delivery times. Still, everyone works from the same single source of truth.
5. The Missing Piece: A Decision Log
Here is our unique take. Most EO PIS guides stop at dashboards. But dashboards only show what happened. They don’t record what you decided or why.
So we suggest adding a simple decision log. Every time a leader acts on an insight, write it down. Note the data you used, the choice you made, and the result you expect. Later, check what actually happened.
Notably, Gartner predicted that 75% of Global 500 firms would log decisions this way by 2026. Over time, your EO PIS learns which calls worked. As a result, your team becomes smarter with every choice.
7 Key EO PIS Strategies That Drive Better Decisions
Having the right parts is only half the battle. Next, you need smart EO PIS strategies to make them work. Here are seven that stand out.
1. Start With Decisions, Not Data
Many firms collect every number they can. Then they drown in it. Instead, list the ten biggest choices your leaders make each quarter. Thereafter, identify the data each choice needs. As a result, this process keeps your system lean and useful.
2. Pick a Small Set of Shared Metrics
Next, choose five to ten metrics that cut across teams. For example, “order-to-cash time” touches sales, finance, and shipping. Shared metrics like this encourage collaboration among teams instead of assigning blame.
3. Improve Data Quality at the Source
Poor data means poor choices. So correct errors where they start, not in the dashboard. For instance, add simple checks to your order forms. Furthermore, give each data set a clear owner.
4. Map Real Processes With Process Mining
Your process chart shows how work should flow. Process mining, by contrast, shows how it really flows. It reads the digital trail your systems leave behind. As a result, hidden delays and extra steps become easy to spot.
5. Automate Alerts, Not Just Reports
Reports require someone to review them. Alerts, on the other hand, come to you. So set clear limits for key metrics. When a number crosses the line, the right person receives a ping right away.
6. Keep Humans in the Loop
AI is powerful, but it can still be wrong. Therefore, let AI suggest and let people make the major calls. In fact, Gartner warns that “black box” AI choices are drawing more and more legal claims. Clear human sign-off protects you.
7. Review and Improve Every Quarter
Finally, treat your EO PIS like a garden.
- First, prune metrics no one uses.
- Then add new ones as your goals shift.
- Furthermore, review your decision log to see which insights led to wins.
EO PIS in Action: Real-World Results and Use Cases
Theory is nice, but results matter more. So let’s look at what this approach can do in the real world.
Case Study: How Siemens Cut Rework
Siemens offers one of the best examples of these ideas at work. The firm used Celonis process intelligence to study its order-to-cash process. And the scale was enormous.
Their data held about 70 million sales order items and 1.5 million process variants. In other words, teams ran the same task in over a million different ways.
So Siemens set three clear goals. They tracked the automation rate, rework rate, and a “digital fit” rate. Teams around the world could then compare their scores and share what worked.
The results were striking. Siemens raised automation by 24% and cut rework by 11% worldwide. Altogether, that meant about 10 million fewer manual touches each year.
Note that Siemens never called this “EO PIS.” Even so, this example demonstrates the framework in practice. They linked process data, picked shared metrics, and acted on what they found.
How Different Industries Use It
The same model works across many fields. For example:
- Manufacturing: Track machine downtime next to order delays. Then plan repairs before they hurt delivery.
- Retail: Link stock levels with sales trends. As a result, you avoid both empty shelves and dead stock.
- Healthcare: Connect bed use, staff shifts, and patient wait times in one view.
- Finance: Flag slow invoice approvals before they harm cash flow.
Common Roadblocks to Watch
Of course, challenges can arise. The biggest hurdle is usually people, not tech. For example, teams may guard “their” data. Plus, old systems may not connect easily. Costs can also climb fast if you try to do everything at once. That’s why a phased rollout, as shown next, works best.
How to Implement EO PIS: A 6-Step Action Plan
Ready to start? Good news: you don’t need a giant budget on day one. Instead, follow this simple plan for how to implement EO PIS step by step.
Step 1: Get a Leader on Board
First, identify an executive sponsor. This person clears roadblocks and keeps teams aligned. Without one, the project can stall when departments disagree. Ideally, pick someone who owns results across several teams, like a COO.
Step 2: List Your Key Decisions
Next, gather your leaders for a short workshop. Ask each one to name the three choices they make most often. Then ask what data they wish they had. Then write it all down, because this list becomes your roadmap.
Step 3: Audit Your Current Tools
Now map what you already own. List every system that holds key data, such as your ERP, CRM, and HR tools. Then mark which ones connect and which ones don’t. Furthermore, note who owns each one. You will likely find you have most of the pieces already.
Step 4: Start With One Pilot Process
Rather than going big, pick one process that hurts. Orders-to-cash and purchases-to-pay are popular choices. Next, connect the data for just that process. Then build one simple dashboard around it.
Step 5: Measure, Learn, and Adjust
After 60 to 90 days, please review the pilot. Did cycle times drop? Did errors fall? Furthermore, ask users what they liked and what confused them. Use those answers to fine-tune your setup.
Step 6: Scale One Process at a Time
Once the pilot works, expand slowly. Add one new process every quarter. Meanwhile, keep your decision log going. Over time, your business intelligence framework grows into a full EO PIS that covers the whole company.
Conclusion
To sum up, EO PIS is not magic, and it’s not a single tool. Instead, it is a smart way to connect the data you already have. When done right, an Enterprise Operations Process Information System gives leaders one clear view of the whole business.
Let’s recap the key points.
- First, EO PIS links data from finance, sales, HR, and operations into one system.
- Second, the system is built on four core layers: data, process, analytics, and dashboards. On top of that, a simple decision log helps your team learn from every choice.
- Third, the seven strategies keep it lean and useful. Start with decisions, use shared metrics, and fix data at the source.
- Then automate alerts and keep humans in charge.
The Siemens story proves the payoff can be big. Yet you don’t need to be a global giant to benefit. Even a small firm can start with one process and grow from there.
So here’s your next move. This week, list the three biggest decisions your team makes each month. Then ask one question: do we have the right data for each one? That simple step is the start of your own EO PIS journey.
Want more listicles like these? Explore our other business tools articles on Businesstories.com, and share this listicle with a leader who needs it.
Frequently Asked Questions About EO PIS
1. What does EO PIS stand for, and why do the definitions vary online?
EO PIS usually stands for Enterprise Operations Process Information System. Some sources say “performance” instead of “process.” Both describe the same idea: one system that links business data to support faster, smarter leadership decisions.
2. Can a small business use an EO PIS, or is it only for big companies?
Yes, small businesses can use an EO PIS. Start with one key process and low-cost cloud tools you already own. Then add more data over time as your budget, team, and business needs grow.
3. How long does it take to set up an EO PIS intelligence system fully?
A first pilot can go live in two to three months. However, a complete EO PIS system for intelligence across the whole company often takes one to two years, since most firms roll it out one process at a time.
4. Does an EO PIS replace our existing ERP, CRM, and BI dashboard tools?
No, an EO PIS does not replace your ERP, CRM, or BI tools. Instead, it connects them. Think of it as a layer on top that links your systems so leaders see one clear picture of business performance.
5. What is the biggest mistake companies make when adopting an EO PIS?
The biggest mistake is collecting too much data with no clear goal. Instead, start with the key decisions your leaders make. Then gather only the data those choices need. This keeps your EO PIS lean and useful.

Tabassum Shaik is an Author, Researcher, and SEO Specialist with over 8 years of experience creating informative content on business, startups, entrepreneurship, marketing, technology, and digital trends. She specializes in researching industry trends and transforming complex topics into practical, easy-to-understand insights. Her goal is to help readers stay informed, learn new ideas, and make better business decisions.